Image Selection
|
To reduce the impact of sunlight, image selection was required. Fifty "good" and "bad" images were selected based on desired contrast of pictures. Images were selected based on mean intensity for red and green. Most of the good images were taken in the morning.
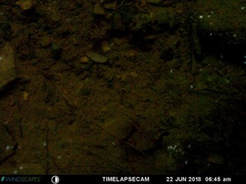
Example of a bad image
|
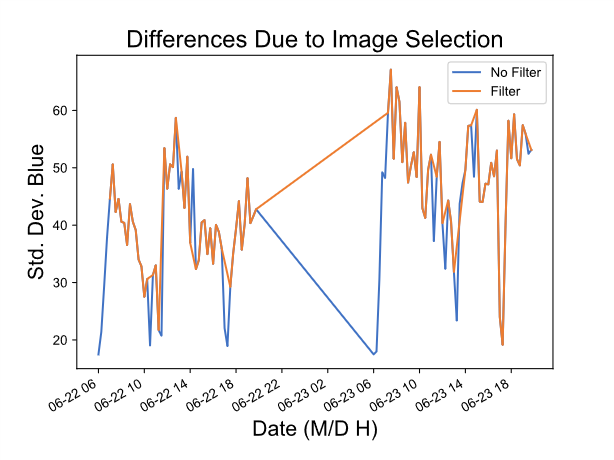
Image selection removed images that were too dark
|
______________________________________________________________________________________________________________________________________________________________
Visual Differences
|
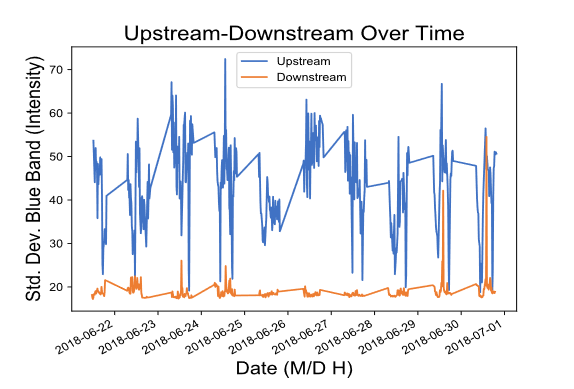
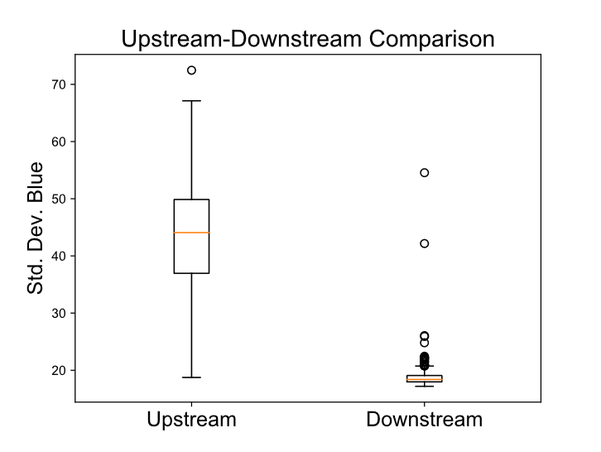
Visible differences between upstream and downstream are evident, especially during storm events. From the calibration, blue pixel standard deviation was correlated with turbidity. The blue pixel standard deviation is larger upstream than downstream.
|
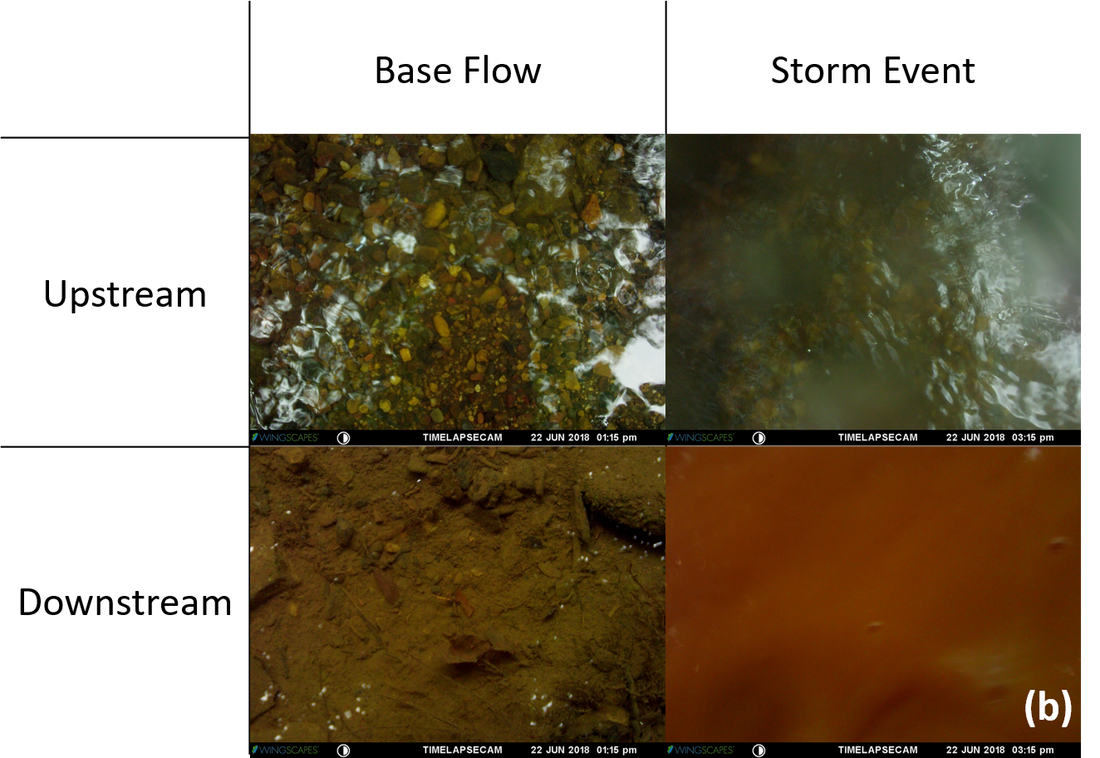
During base flow downstream has more deposited sediment and during storm events the water is more turbid
|
______________________________________________________________________________________________________________________________________________________________
Upstream-Downstream Comparison
Upstream and downstream datasets were tested for normality. Additionally, Student’s t-test showed P < 0.001 indicating significant difference. The outliers are due to glare from the sun and condensation.
______________________________________________________________________________________________________________________________________________________________
Conclusion
Turbidity imaging is a cheap and viable alternative to traditional methods of turbidity monitoring. However, further research must be conducted if it is to be used as a turbidity estimate. The Mountain Valley Pipeline is causing a significant increase to turbidity for Buck Creek.
