STEP 1: CALIBRATION
|
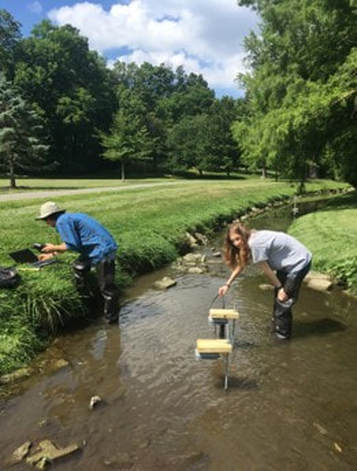
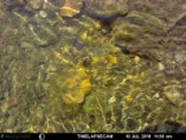
The first step for checking the reliability of the camera system was a calibration. A time-lapse digital camera pointed at the stream-bed and a traditional turbidity sensor recorded close-range images and turbidity measurements, respectively. Turbidity was simulated by creating a disturbance upstream by kicking up rocks and sediment. A baseline turbidity was taken without any disturbance first for 3 minutes. Then a probe recorded the actual turbidity for five minutes, while the cameras captured images every 30 seconds.
|
|
|
The calibration took place in Stroubles Creek
|
______________________________________________________________________________________________________________________________________________________________
STEP 2: COMPARE IMAGE STATISTICS
|
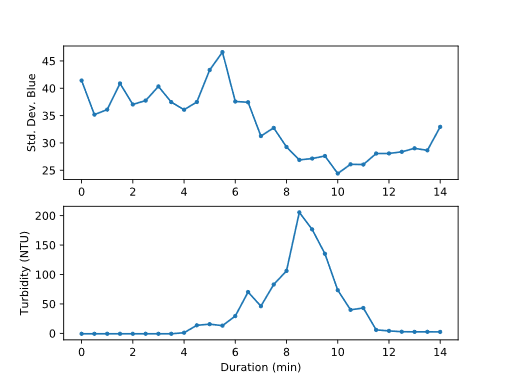
Global image statistics were used to isolate potential image characteristics correlated with turbidity, which, for these sites was the standard deviation of blue pixel intensity. Other statistics were compared too, but the Std. Dev. Blue gave the most similar results to the probe. From the calibration data graph it is evident that there is some kind of correlation between the chosen property and turbidity.
|
|
|
|
|
|
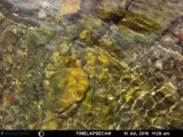
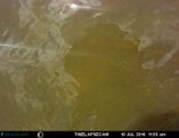
The images correspond to the beginning, peak, and end of the top graph
|
______________________________________________________________________________________________________________________________________________________________
STEP 3: EVALUATE CALIBRATION PEAK
|
The turbidity spike in the graph was studied from 5.5 to 10.5 minutes to create a correlation with turbidity. This gave a correlation coefficient of 0.64. The coefficient suggests that there is a strong positive correlation between standard deviation of blue and turbidity. Since there is a strong positive correlation, it can be concluded that turbidity and Std. Dev. Blue are related to each other.
|
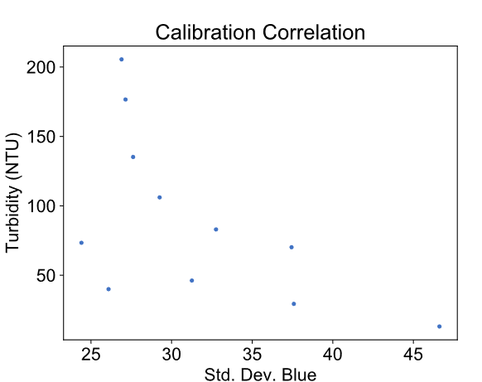
Std. Dev. of the blue band has the strongest correlation
|
______________________________________________________________________________________________________________________________________________________________
STEP 4: DEPLOY CAMERAS
|
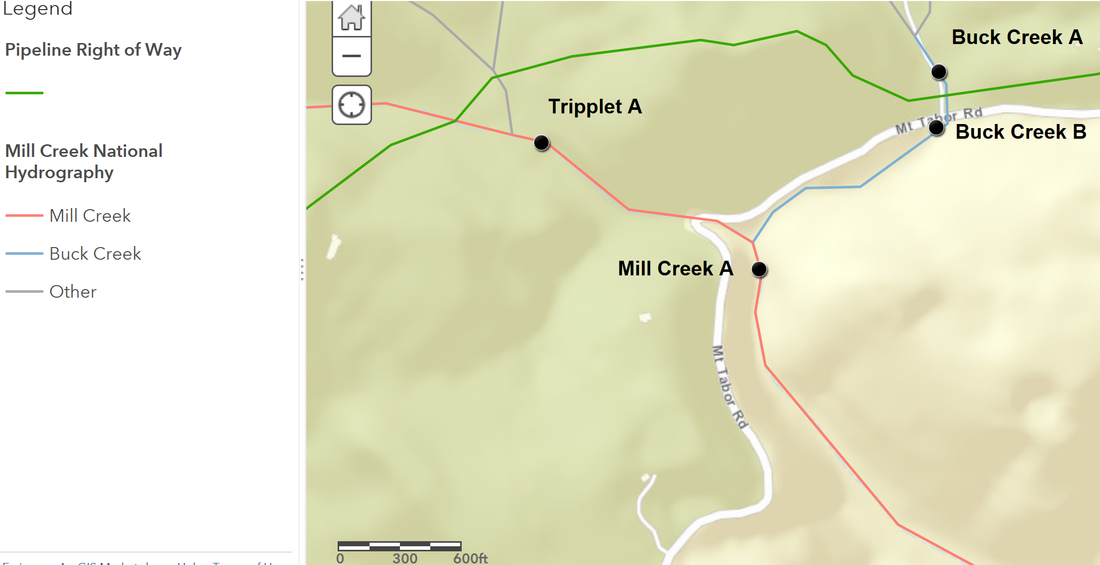
Once the calibration was complete, the cameras could finally be deployed.Four cameras were placed at Buck A, Buck B, Mill Creek A and Triplett A. They recorded images of the creeka every 15 minutes from 6am - 8pm. During storm events or times of disturbance, the water became turbid resulting in cloudier images of the water. Using image statistics during these disturbances, we compared upstream and downstream to quantitatively analyze the effects of the pipeline.
|
|
|
Camera Locations
|
